Peaka Big Table: Handling Large Datasets
Peaka Big Table is primarily designed for efficiently managing vast datasets, with a focus on high-speed data filtering. It is particularly well-suited for situations where rapid data retrieval is essential. However, it is not the ideal choice for extensive data editing, as editing operations can be relatively slow within Peaka Big Table. Common Uses of Peaka Big Table:- Uploading and filtering substantial datasets.
Peaka Table: Suited for Small Data Management
Peaka Table, on the other hand, excels in tasks involving smaller datasets. It offers capabilities for inserting, editing, deleting, and filtering data, making it ideal for precise data manipulation. If you have a substantial dataset and intend to use Peaka Table, be prepared for potentially longer processing times. Common Uses of Peaka Table:- Managing and editing smaller datasets, such as customer information and financial data.
- It’s worth noting that Peaka Big Table does not support certain data types, such as JSON. In contrast, Peaka Table is more versatile in this regard, accommodating a wider range of data types.
Conclusion
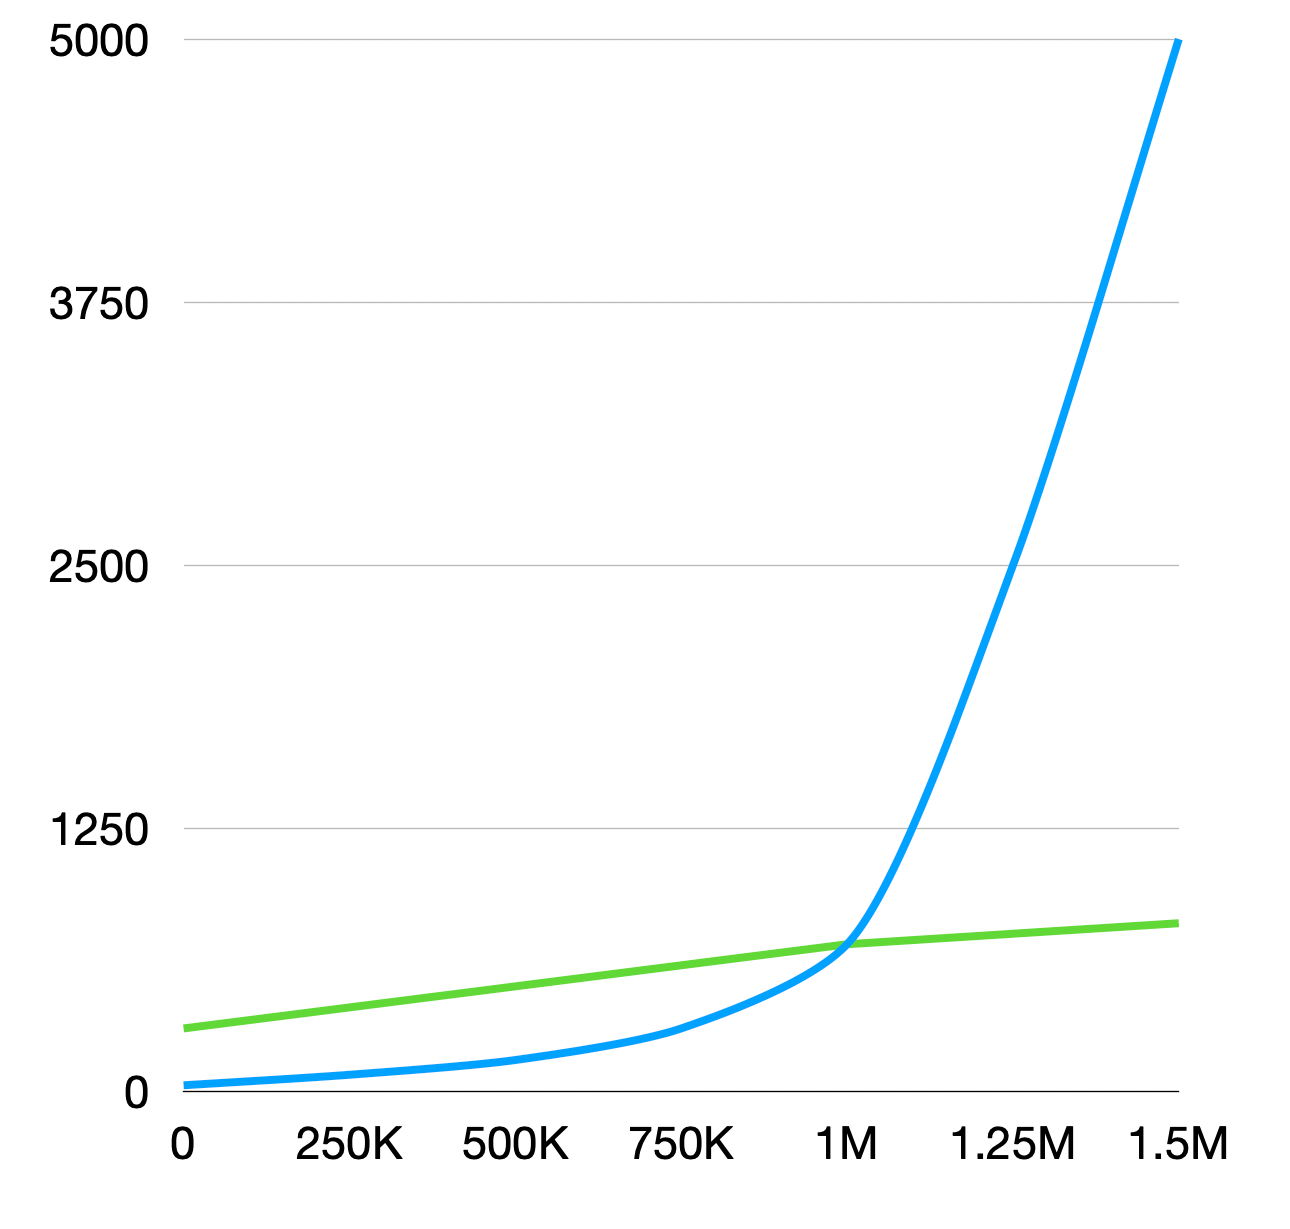
Peaka Table and Peaka Big Table cater to distinct data management needs. To make the right choice, consider the size of your dataset and your specific data type requirements. Peaka Big Table excels in handling large datasets swiftly, while Peaka Table is best suited for managing, editing, and manipulating smaller datasets with diverse data types. You can observe variations in query times as the dataset size increases, as depicted in the chart below (note that the values shown are for illustration purposes and not actual data). The blue line in the graphic represents Peaka Table, while the green line corresponds to Peaka Big Table.